Súbor:NSIDC arctic sea ice extent since 1979.svg

Veľkosť tohoto PNG náhľadu tohoto SVG súboru: 800 × 533 pixelov. Iné rozlíšenia: 320 × 213 pixelov | 640 × 427 pixelov | 1 024 × 683 pixelov | 1 280 × 853 pixelov | 2 560 × 1 707 pixelov | 810 × 540 pixelov .
Pôvodný súbor (SVG súbor, 810 × 540 pixelov, veľkosť súboru: 37 KB)
Zhrnutie
| Popis |
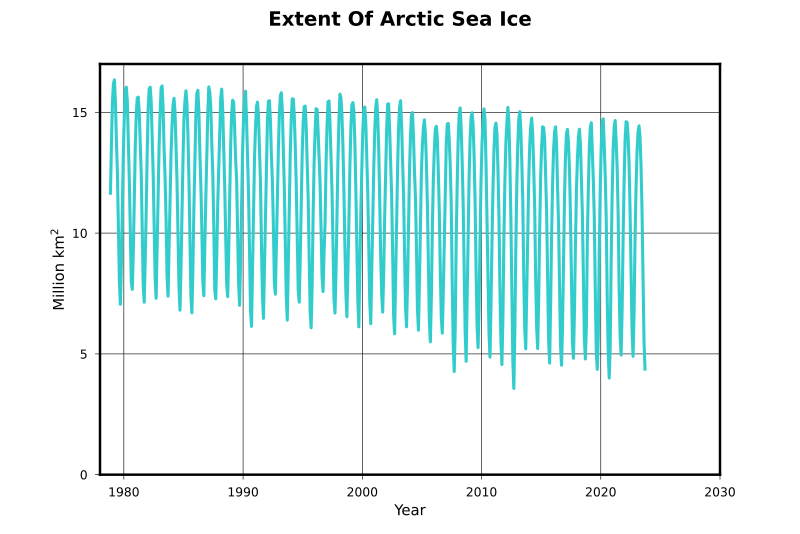
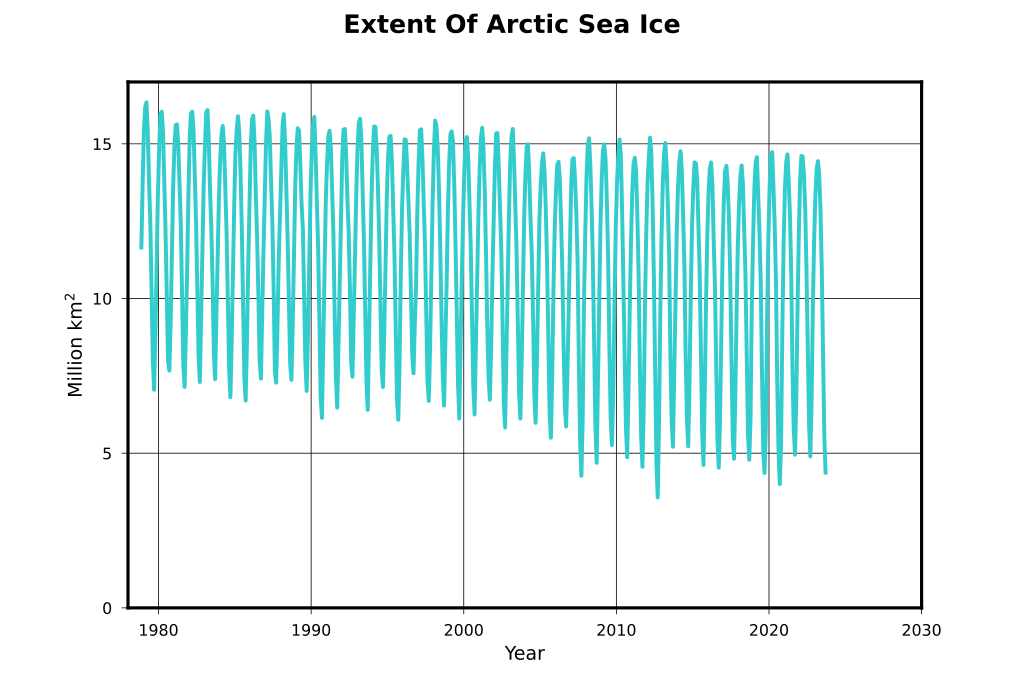
English: Plot of arctic sea ice extent development between 1979 and 2023 in monthly mean values. For the determination of the "area" value, every pixel with a sea ice concentration > .15 is taken. The pixel area is multiplied with the concentration value derived from the passive infrared signal. For the "extent" value, the concentration value is taken as 1, so we basically get full area with >.15 concentration.
Deutsch: Verlauf der Umrissfläche des arktischen Meereises in Monatsmittelwerten von 1979 bis 2023. Für die "area"-Daten werden alle Pixel mit einer Eiskonzentration > 0.15 genommen und deren Fläche mit der Eiskonzentration multipliziert. Für die "extent"-Daten wird diese Eiskonzentration =1 gesetzt - so erhält man die Gesamtfläche mit überhaupt irgendwelchem Eis. |
| Dátum | |
| Zdroj | Vlastné dielo |
| Autor | Dominiklenne |
Data source: Fetterer, F., K. Knowles, W. Meier, and M. Savoie. 2002, updated until 2010. Sea Ice Index. Boulder, Colorado USA: National Snow and Ice Data Center. Digital media. ftp://sidads.colorado.edu/DATASETS/NOAA/G02135/. Corresponding website: http://nsidc.org/data/seaice_index/archives/index.html
For the area definition see: https://nsidc.org/learn/ask-scientist/what-difference-between-sea-ice-area-and-extent
Licencovanie
| Ja, držiteľ autorských práv k tomuto dielu, uvoľňujem toto dielo ako voľné dielo (public domain). Toto platí celosvetovo. V niektorých krajinách to zákon neumožňuje; v tom prípade: Udeľujem komukoľvek právo používať toto dielo na ľubovoľné účely, bez akýchkoľvek podmienok ak také podmienky nevyžaduje zákon. |
História súboru
Po kliknutí na dátum/čas uvidíte ako súbor vyzeral vtedy.
| Dátum/Čas | Náhľad | Rozmery | Používateľ | Komentár | |
|---|---|---|---|---|---|
| aktuálna | 17:48, 23. október 2023 | | 810 × 540 (37 KB) | Dominiklenne | update to october 2023 |
| 21:07, 9. máj 2023 |  | 810 × 540 (37 KB) | Dominiklenne | update to april 2023 | |
| 19:12, 4. marec 2022 |  | 810 × 540 (36 KB) | Dominiklenne | update until february 2022 | |
| 00:39, 7. november 2020 |  | 810 × 540 (42 KB) | Dominiklenne | update until october 2020 | |
| 17:16, 27. október 2019 |  | 810 × 540 (45 KB) | Dominiklenne | data added until september 2019, year scale extended to 2030 | |
| 22:35, 30. október 2018 |  | 810 × 540 (47 KB) | Dominiklenne | data updated until september 2018 | |
| 22:44, 8. júl 2017 |  | 810 × 540 (47 KB) | Dominiklenne | data updated until june 2017 | |
| 21:43, 22. júl 2016 |  | 810 × 540 (47 KB) | Dominiklenne | data updated until june 2016 | |
| 21:43, 27. august 2015 |  | 810 × 540 (40 KB) | Dominiklenne | minor y scale change to the same as in https://commons.wikimedia.org/wiki/File:Plot_arctic_sea_ice_area.svg | |
| 17:03, 27. august 2015 |  | 810 × 540 (40 KB) | Dominiklenne | update until 2015 / 07. Use of python matplotlip pyplot instead of Gnumeric. Slightly different y-scale for better exhaustion of plot area. |
Použitie súboru
Žiadne stránky neobsahujú odkazy na tento súbor.
Globálne využitie súborov
Nasledovné ďalšie wiki používajú tento súbor:
- Použitie na ar.wikipedia.org
- Použitie na bn.wikipedia.org
- Použitie na de.wikipedia.org
- Použitie na en.wikipedia.org
- Použitie na fa.wikipedia.org
- Použitie na fr.wikipedia.org
- Použitie na it.wikipedia.org
- Použitie na ko.wikipedia.org
- Použitie na la.wikipedia.org
- Použitie na mk.wikipedia.org
- Použitie na nn.wikipedia.org
- Použitie na no.wikipedia.org
- Použitie na sq.wikipedia.org
- Použitie na sv.wikipedia.org
- Použitie na uk.wikipedia.org
- Použitie na zh.wikipedia.org